Fortigate Version Update 5.0 ve 5.2

I wanted to talk a little bit about Fortigate firewall Version 5 and the next version, Version 5.2. To say something about the new features and pros of the new version, Version 5 was already a revolution in itself after Version 4.
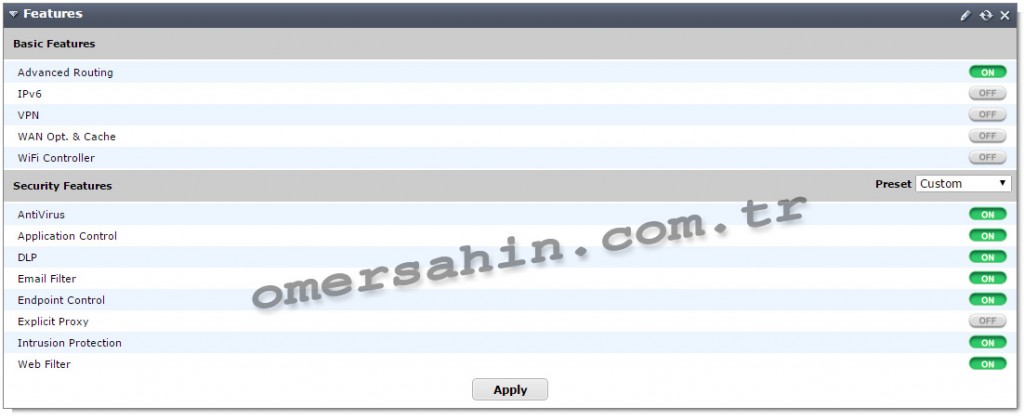
The innovation I saw at first glance is undoubtedly the firewall, ipv4, ipv6, dhcp, nat, wan opt and cache and ips. Thus, when you do not use these services, it is as if they do not exist on the firewall at all. As a result, you get cpu and memory usage as a bonus.
The load on processor and Ram is completely eliminated. You can stop these services from the“Features” section that appears as a widget on the Dashboard page. This article has been prepared and tested according to FortiOS V.5.2 running on Fortigate 300D model firewall.
You can also see more details in System>Config>Features.
Index
Fortigate Version 5.xx Menu
Another difference I noticed is the Fortiview section added to the“System menu“. From this section, you can follow instant and recent log records. If you have a logging device, you can view Analyzer logs from this section, provided that you make adjustments in the Log Settings section. If you do not have a FortiAnalyzer logging product, you can see the data of the log records on the hard disk on Fortigate.
Let’s examine a few of the statistics available in the Fortivew section. You can see the statistical log records in this section as “instant, 5-minute, 1-hour and Last 24 hours” logs.

1. SOURCES:
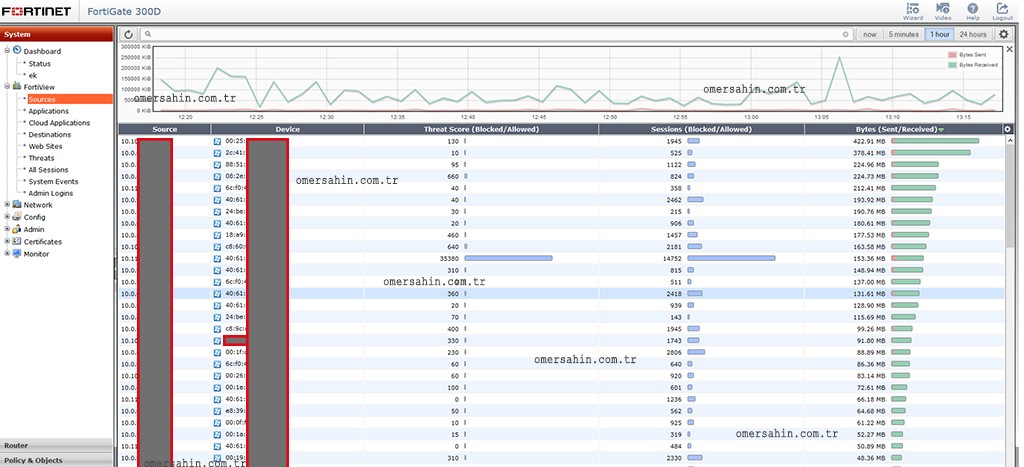
The Source section under the Fortivew menu shows the connection statistics of the users accessing the internet. Session and bandwidth information of the traffic in the specified time period is listed based on ip and mac address.
Double click on the relevant IP number and the band and session information of that user will be displayed. It is possible to sort by clicking on the table titles. You can also search by filtering from the search line (ip and mac information is blacked out for privacy reasons).
2. APPLICATIONS:
In the Application section, you can see which protocols and applications the traffic flows through, the size of the traffic in bytes and the sessions generated. Again, you can see it on an instant-5-minute, 1-hour and daily basis.
Double-click on each row and you will see information about the users using that protocol. You can also make a search by filtering from the search line.
3. CLOUD APPLICATIONS:
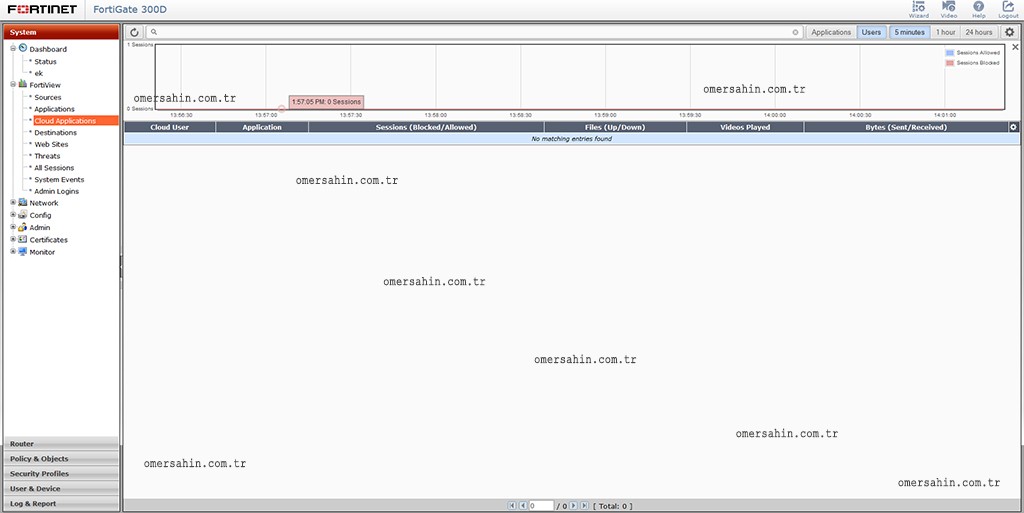
It displays the statistics of the data sent to remote cloud servers located outside the network. However, since the communication between the cloud servers and the user is encrypted with SSL, SSL/SSH Inspection configuration in the Policy&Objects menu is required.
4. DESTINATIONS:
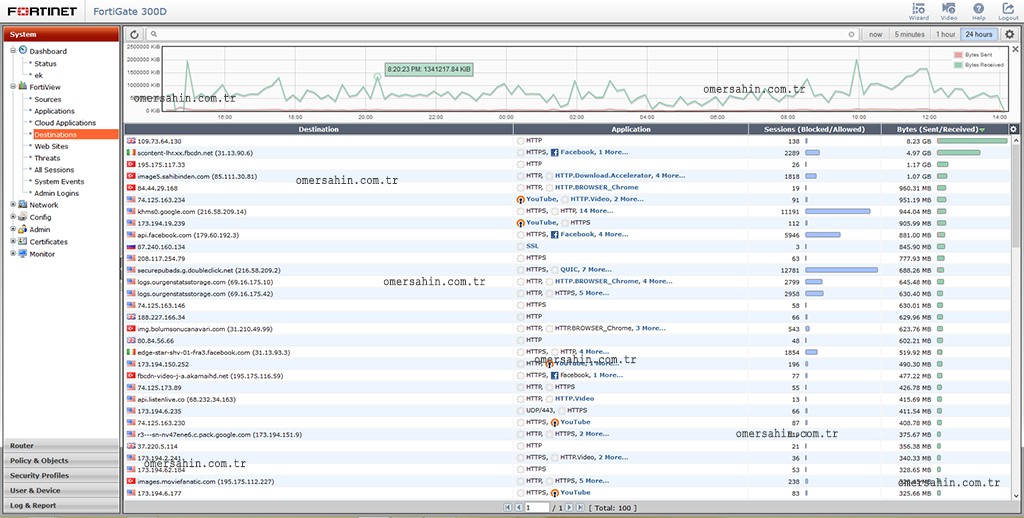
It displays statistical data on which target ip addresses your users are communicating with and over which protocols, the size and category of the traffic in bytes.
5. WEB SITES (Internet Sites):
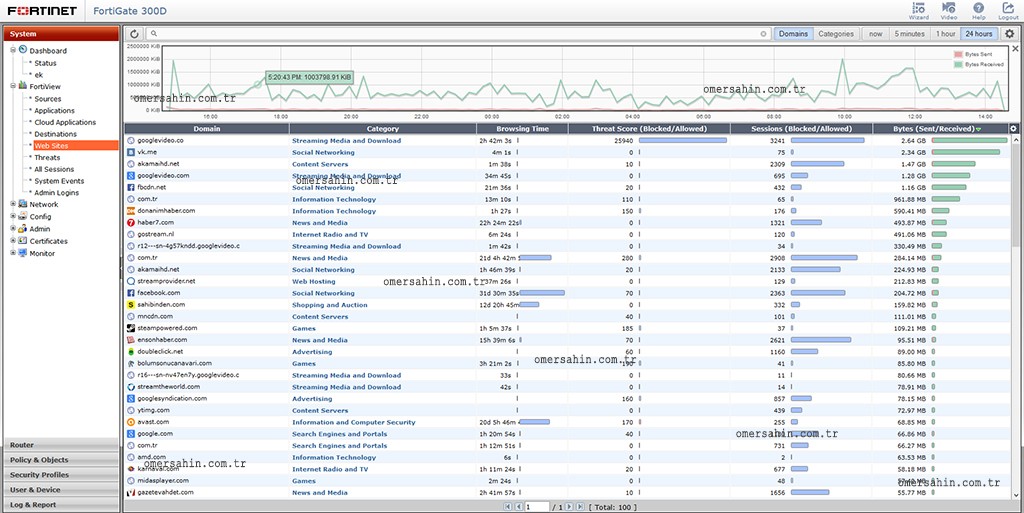
This is the section where you can see the ranking, categorization and traffic size in bytes of the websites visited by your users in the selected time interval. You can also find information on how much time users spent on the selected website in total on this page.
When you double click on the records, you can see detailed information such as which users visited that site. With the Domain and Categories buttons at the top, you can pour domain-based or category-based statistics.
6. THREATS:
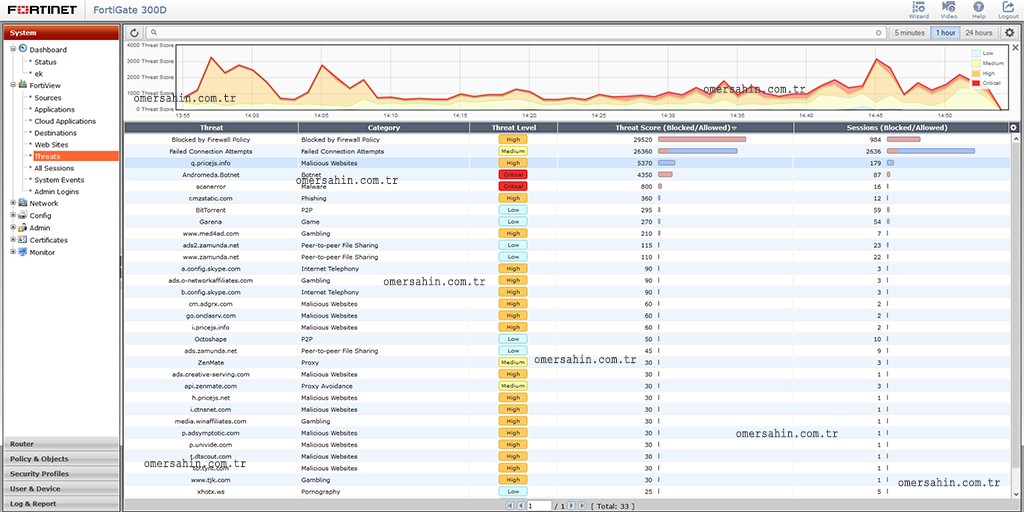
It is the page where you can see the attacks and risks made to the network from outside through IPS or Applications and examine them in detail and further increase the degree of resistance in that category. On this page you can also see the viruses that have passed the antivirus scan and have been quarantined.
In fact, I can say that it is one of the most functional and vital pages because we can quickly see the attacks and infections that have been made directly to network security. If you can monitor this page daily, you can get rid of possible attacks on the network in the future by taking precautions in advance.
7.ALL SESSIONS:
As the name suggests, information about user sessions accessing the internet via Fortigate version 5.xx can be monitored from this section for a specified period of time. The answer to your questions such as who is on which website right now or what user A is doing on the internet, which ports he/she is using, etc. is here.
8. SYSTEM EVENTS:
It displays the logs of important events that occur on the firewall at specified time intervals by categorizing the logs and their severity. For example,“Configuration Changed“,“Administrator Password Entered Incorrectly“.
9.ADMIN LOGINS (Administrator Logins):
A table showing the entry and exit times of the administrators is displayed. When you double click on the relevant record in this table, a list of all the work and transactions made with that administrator’s authorization will be displayed.


